Immunity AI Hub
Contact & partnerships
Computational pathology · Immunotherapy biomarker

Detect, map and quantify tertiary lymphoid structures on routine H&E.

Our deep learning model quantifies tertiary lymphoid structures (TLS) on standard H&E slides and has been clinically validated as a predictor of immunotherapy response in a phase III trial. No additional staining is needed, and every result is explained.

Overview

TLS analysis, new biomarker discovery and faster studies from routine H&E

The platform detects and quantifies every TLS, then compares TLS features with your own cohort data (treatment response, survival, PD-L1 or any custom analysis) to find new biomarkers. It starts from the routine H&E, with no extra sections, staining or manual annotation. The video uses mRECIST response as one example.

The tissue and cohort data in this video are illustrative. The results in the sections below come from real annotated images.

DETECT · QUANTIFY · COMPARE AND DISCOVER · EXAMPLE: mRECIST
Our approach

We analyse, we explain, and we built the model

01 · Analysis

We run the analysis for you

You share routine H&E slides; we return a quantitative TLS profile for every case.

  • Detection and mapping of each TLS
  • Quantitative TLS measurements for every case
  • Comparison with your clinical or biomarker data, or any custom analysis
  • Discovery of new biomarkers, with fewer steps than staining-based workflows
02 · Explanation

We explain every result

Each result is traceable to the tissue, so pathologists can verify it.

  • AI probability map over the original H&E
  • Side-by-side comparison with expert annotation
  • Cell-level evidence behind each call
03 · Technology

Our own deep learning model

A novel deep learning model we developed for tertiary lymphoid structures on routine H&E.

  • Trained on pathologist-annotated H&E
  • Tested on images held out from training
  • Checked against multi-marker IHC
Detection & quantification

Agreement with the pathologist, field by field

Move the divider to compare the H&E with the AI map. The dashed line is the pathologist's annotation; the panel compares the AI's measurements with the pathologist's. Each map was produced by a model that had not seen that image during training.

Independent check · Immunohistochemistry

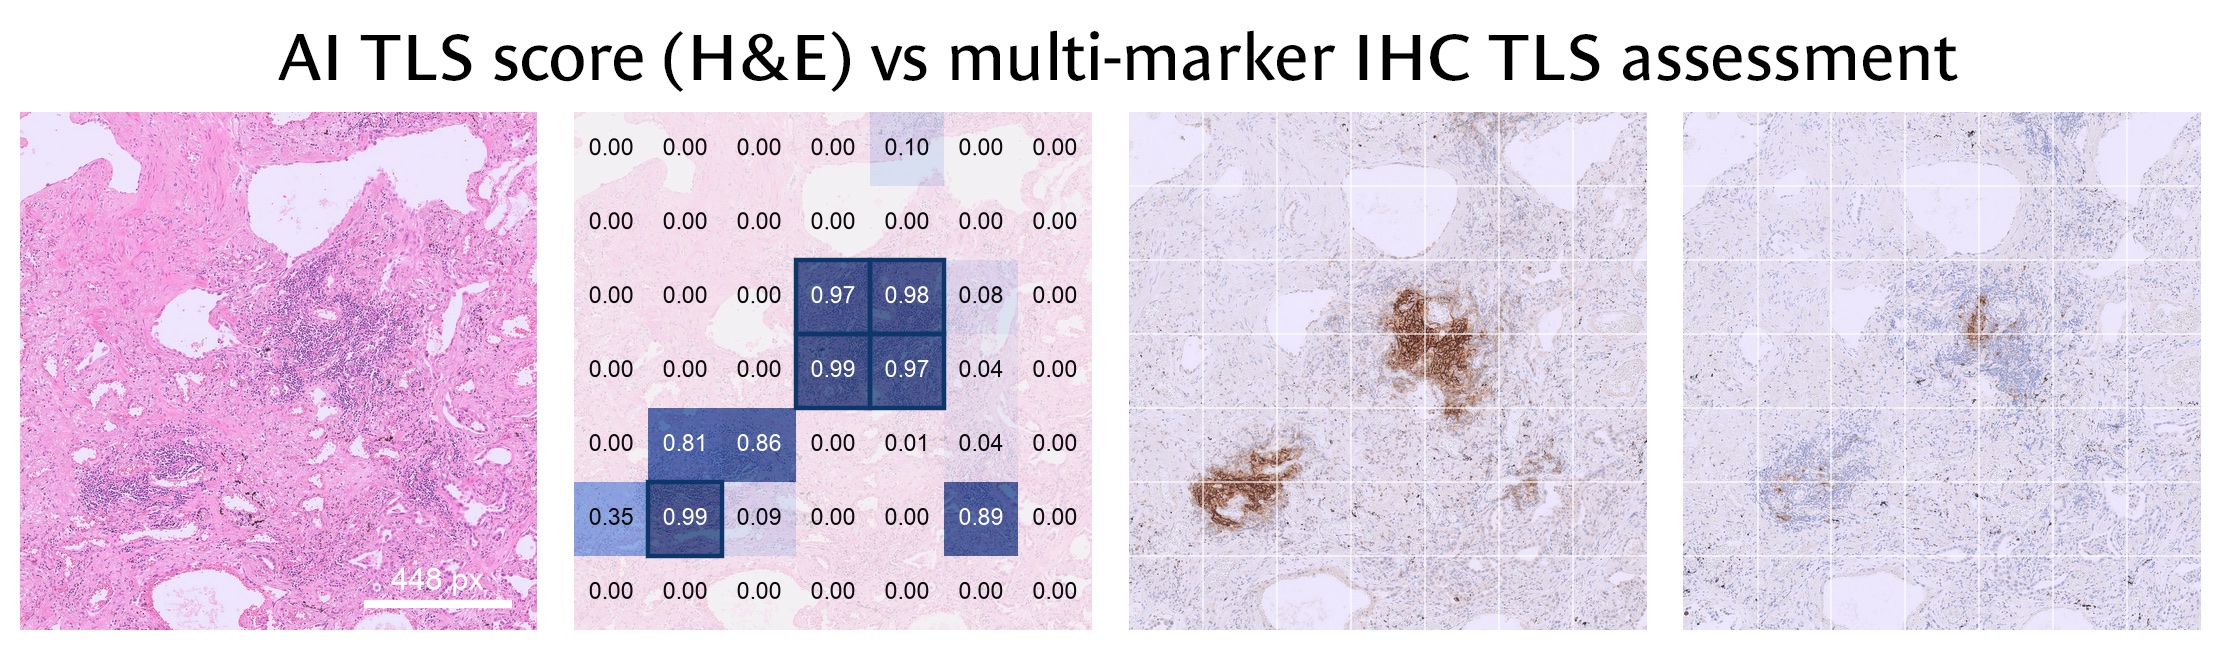
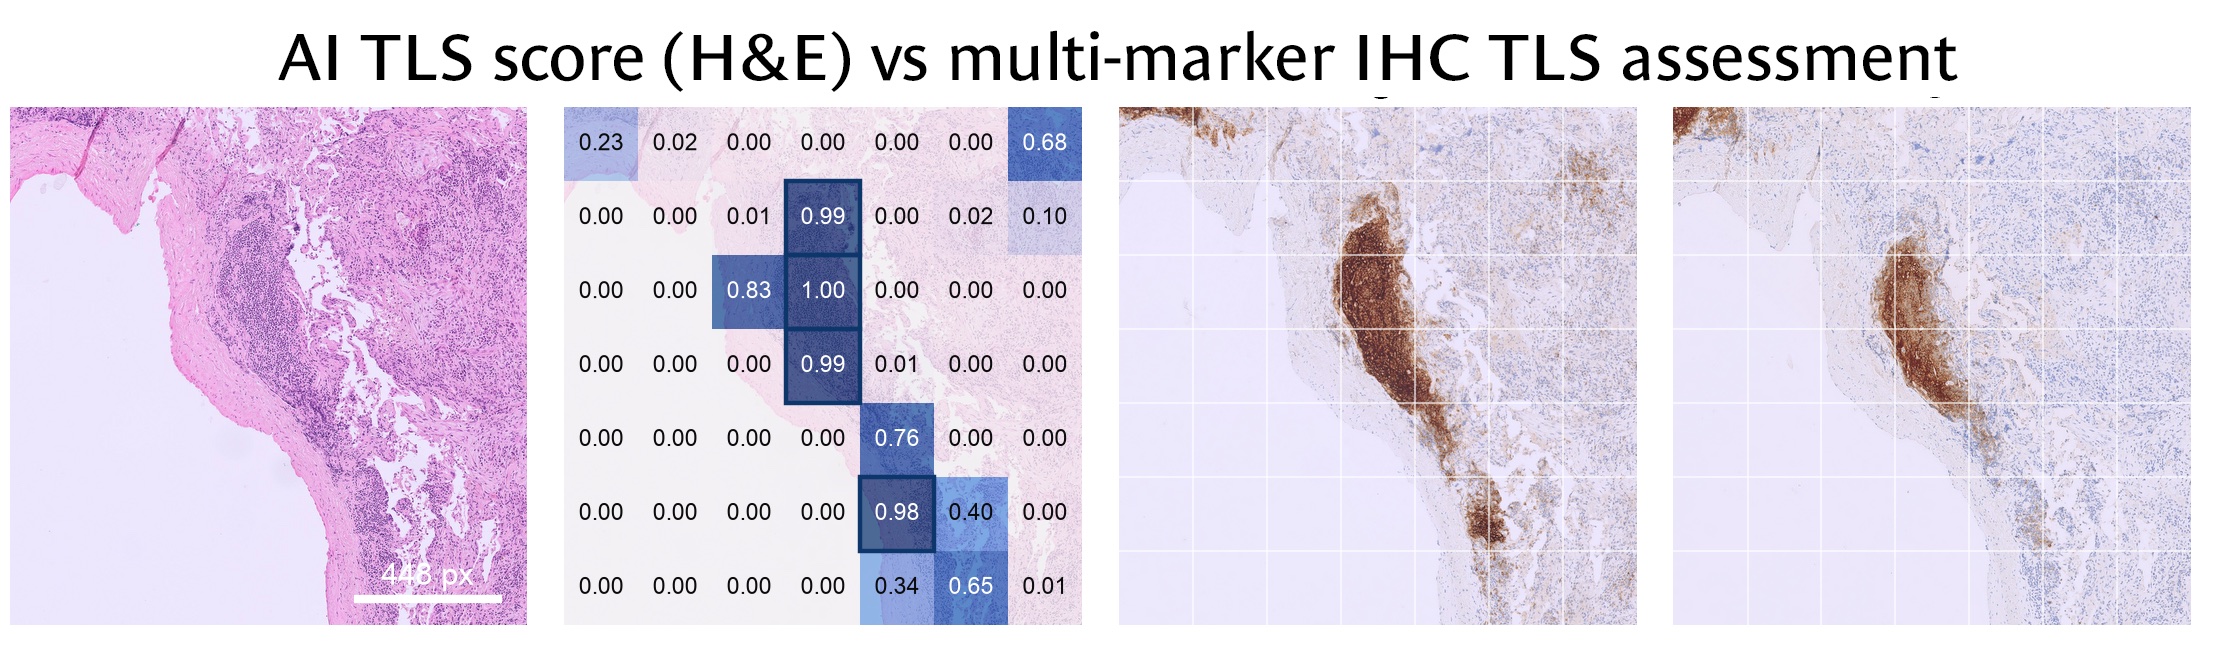
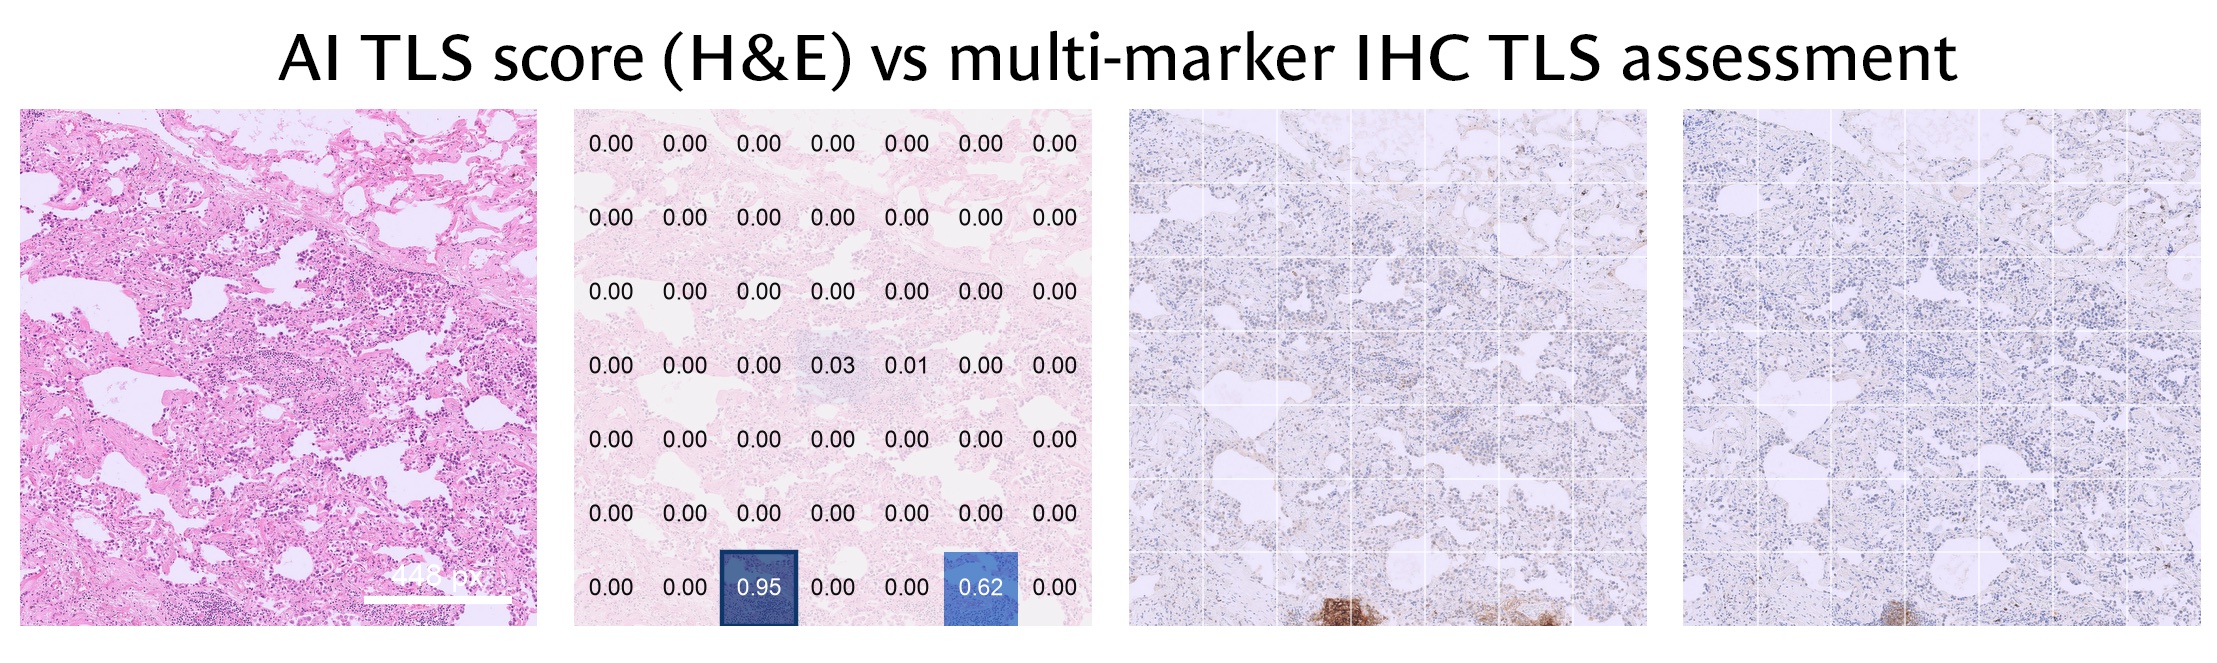
Where the model scores high on H&E, immunohistochemistry confirms TLS

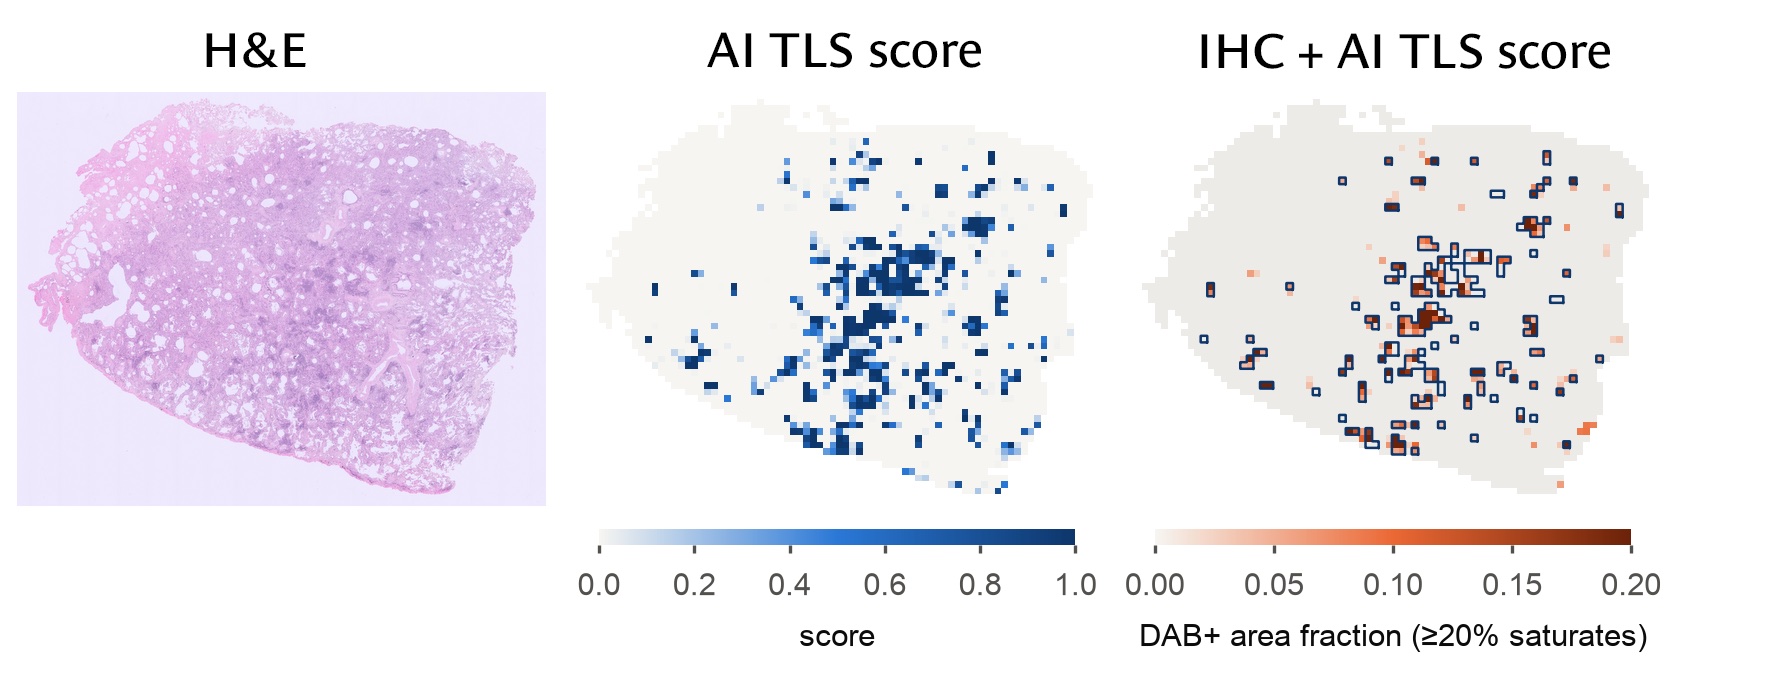
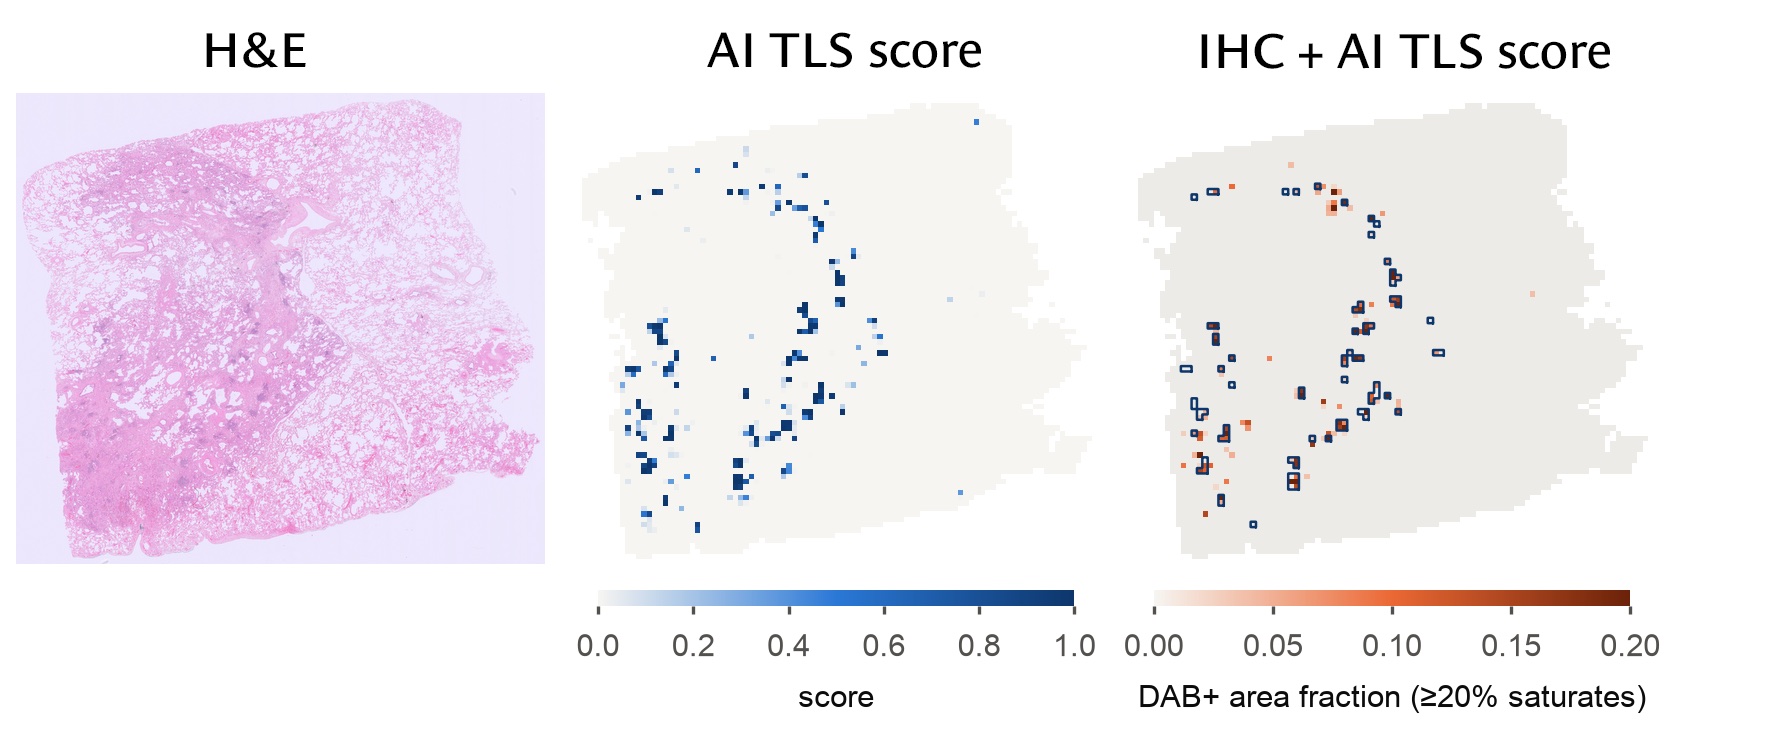
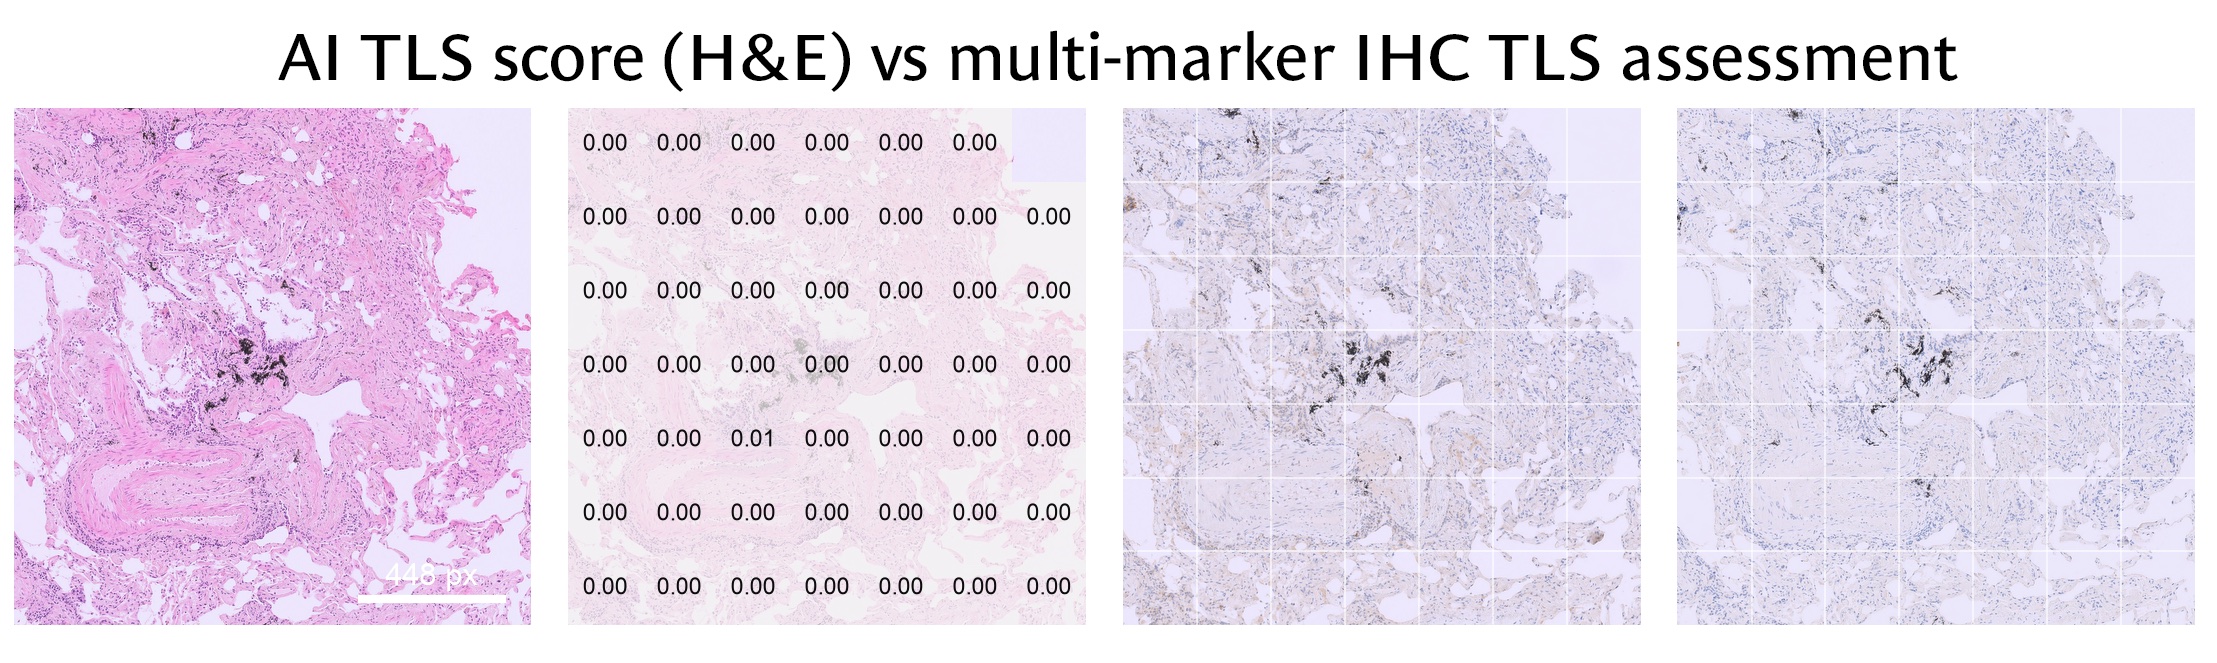
We compared the AI's TLS score on H&E with a multi-marker IHC assessment of TLS on slides aligned to the same tissue. The model never saw the IHC. The same check works with any IHC marker or panel, including your own.

Left to right: H&E · AI TLS score · IHC staining (orange) with the AI's TLS regions outlined

Whole lung slide: H&E, the AI TLS score, and the IHC staining with the AI's TLS regions outlined; the outlined regions sit on stained areas
Slide 1. The regions the AI scores as TLS cluster where the IHC stains.
Second whole lung slide: H&E, the AI TLS score, and the IHC staining with the AI's TLS regions outlined; the outlined regions follow the stained areas
Slide 2. The same pattern on a slide with fewer, smaller TLS.
Explainability

Why the model identifies a region as TLS

The model's decisions align with features a pathologist can verify: dense, small nuclei, and a pattern that holds in every case. Hover over or tap the charts for values.

Tissue signature

How TLS differ from the surrounding tissue

Median inside annotated TLS divided by the median in the surrounding tissue. Values right of 1 are higher in TLS.

Consistency

Denser than the surrounding tissue in every image

Median nuclear density inside TLS and in the surrounding tissue of each image, sorted by the difference.

Inside TLSSurrounding tissue
Clinical survey · about 3 minutes

For pathologists, oncologists and researchers

Tell us where predicting immunotherapy response is hardest in your work, and whether the TLS analysis on this page would help. Your answers guide what we build through the ICURe Discovery programme; only your role is required.

Work in pharma, biotech, a CRO or a digital pathology company? Take the industry survey instead (about 8 minutes) →

Using it in your work
Which cancer types do you work with? Select all that apply.
Where would you apply it? Select all that apply.
What would matter most to you? Select up to two.
If it were available today, how likely would you be to use it in the next 12 months?
How would you prefer to use it?
Next step
Would you like any of these? Select all that apply.
About us

The team behind Immunity AI Hub

We bring together AI research, clinical histopathology and technology transfer to take TLS analysis from the lab to the people who need it.

  • Panagiotis Barmpoutis

    Senior Research Data Scientist

    Entrepreneurial Lead
  • Francois Ng Kee Kwong

    Clinical Researcher, Histopathologist

    Principal Scientific Advisor
  • Francois-Xavier Robert

    Technology Transfer Officer

    Technology Transfer
Latest publication · Phase III validation · ESMO Congress 2026

Machine-learning-based detection of tertiary lymphoid structures predicts immunotherapy response in mesothelioma

We validated our TLS model on routine H&E slides from nivolumab-treated patients in the phase III CONFIRM trial (NCT03063450). Patients with TLS-high tumours showed significantly greater tumour shrinkage on mRECIST than those with TLS-low tumours, and TLS-high status was independently associated with longer overall and progression-free survival.

Barmpoutis P, Moazzen H, Poile C, Ibrahim TS, Ewings SM, Griffiths G, Fennell DA, Ng Kee Kwong F. Presented 26 October 2026.

Read the abstract on the ESMO website
Mean best mRECIST change, TLS-high vs TLS-low
−7.2% vs +9.5%p = 0.01
Overall and progression-free survival, TLS-high
Improvedp < 0.05
Nivolumab-treated patients analysed (53 TLS-high, 27 TLS-low)
80
Earlier work · PLoS ONE 2021

Tertiary lymphoid structures (TLS) identification and density assessment on H&E-stained digital slides of lung cancer

One of the first approaches to automated identification and quantification of TLS on routine H&E slides.

Barmpoutis P, Di Capite M, Kayhanian H, Waddingham W, Alexander DC, Jansen M, Ng Kee Kwong F. (2021) PLoS ONE 16(9): e0256907. doi.org/10.1371/journal.pone.0256907

Read the article in PLoS ONE
Contact & partnerships

Work with us

We are partnering with early adopters: pathology groups, translational researchers and industry teams who want TLS measurements from their own H&E slides.

  1. Tell us about your interest or question.
  2. We reply by email to arrange a short call.
  3. Together we scope a pilot on a sample of your slides.

Reason for contacting us * Select all that apply.